Reporting

Reports that say what to do next

A live dashboard, a sell-through report that flags dead stock in cash terms, and a daily email of what happened.
The reports

Every report a shop owner actually opens

The problem: Most systems have one dashboard and an export button. These are the questions the reports answer.

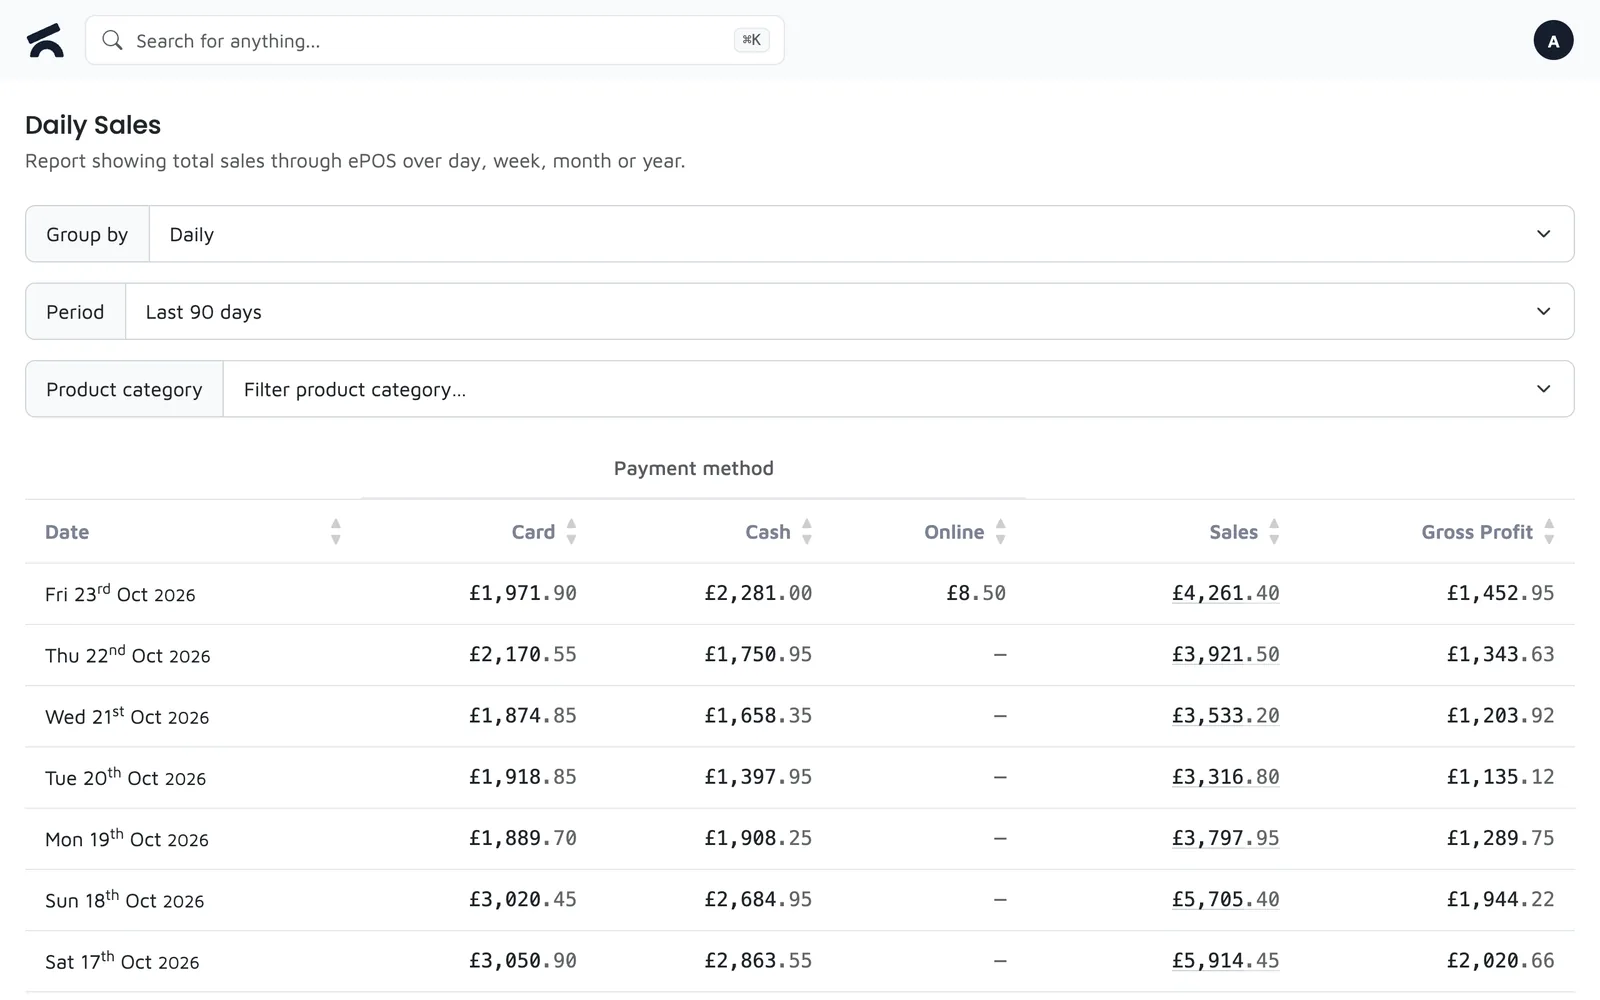
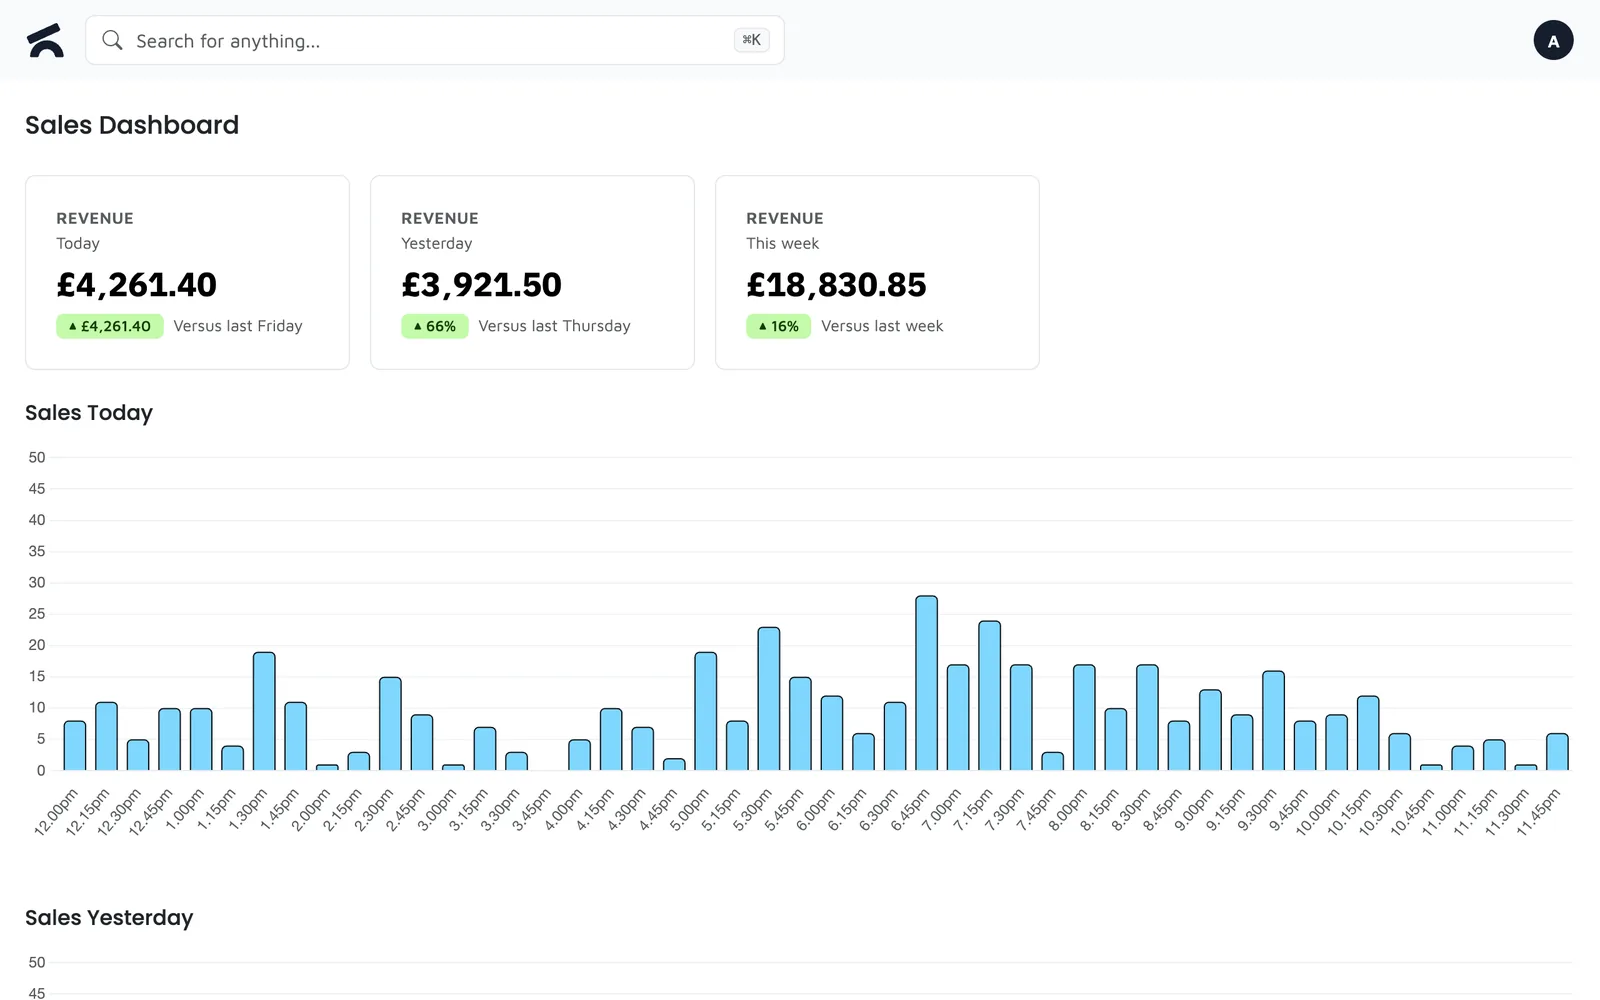
  • How did we do? Sales Dashboard, Sales Totals by day, week, month or year, and the All Sales Report down to the line.
  • What sold, and how much of it? Sales Volume in pints, litres and kilos, Top Sellers by revenue, and Employee Sales.
  • What is the stock doing? Sell Through with dead stock, weeks of cover and the cash tied up.
  • What does the inspector or accountant need? Z-Reports, the Allergen Report, categorised expenditure and year to date.

Key Capabilities

Numbers with a next step
1
Start the day informed
A daily email with yesterday's takings and the tasks completed, to the people who should get it.
2
Find the money in your stock
Top sellers ranked by revenue, not just by count; dead and overstocked lines judged against each product's own pace, with the cash tied up totalled at the top.
3
Hand it to the accountant
Accounting reports, categorised expenditure, year to date and end of year reports, ready to hand over.

Read your own numbers

Bring last month's takings to the demo and compare.